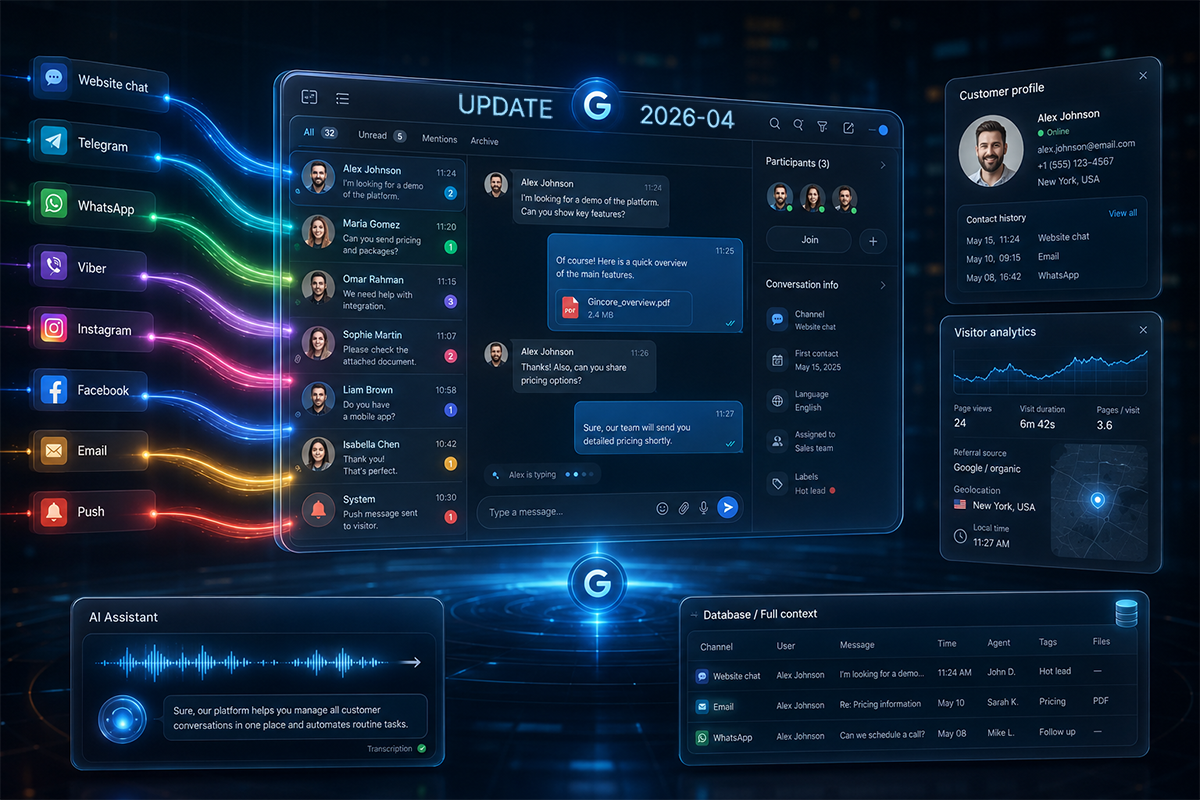
We are excited to introduce the updated Gincore—now even simpler and more convenient to use! Our team works tirelessly to improve the platform, providing you with the most advanced tools for business management. This update opens new horizons for performance analysis and automation of key processes.
Following the principle of the great management guru Peter Drucker, that “we can only manage what we can measure,” we are introducing revolutionary features for comprehensive business analytics.
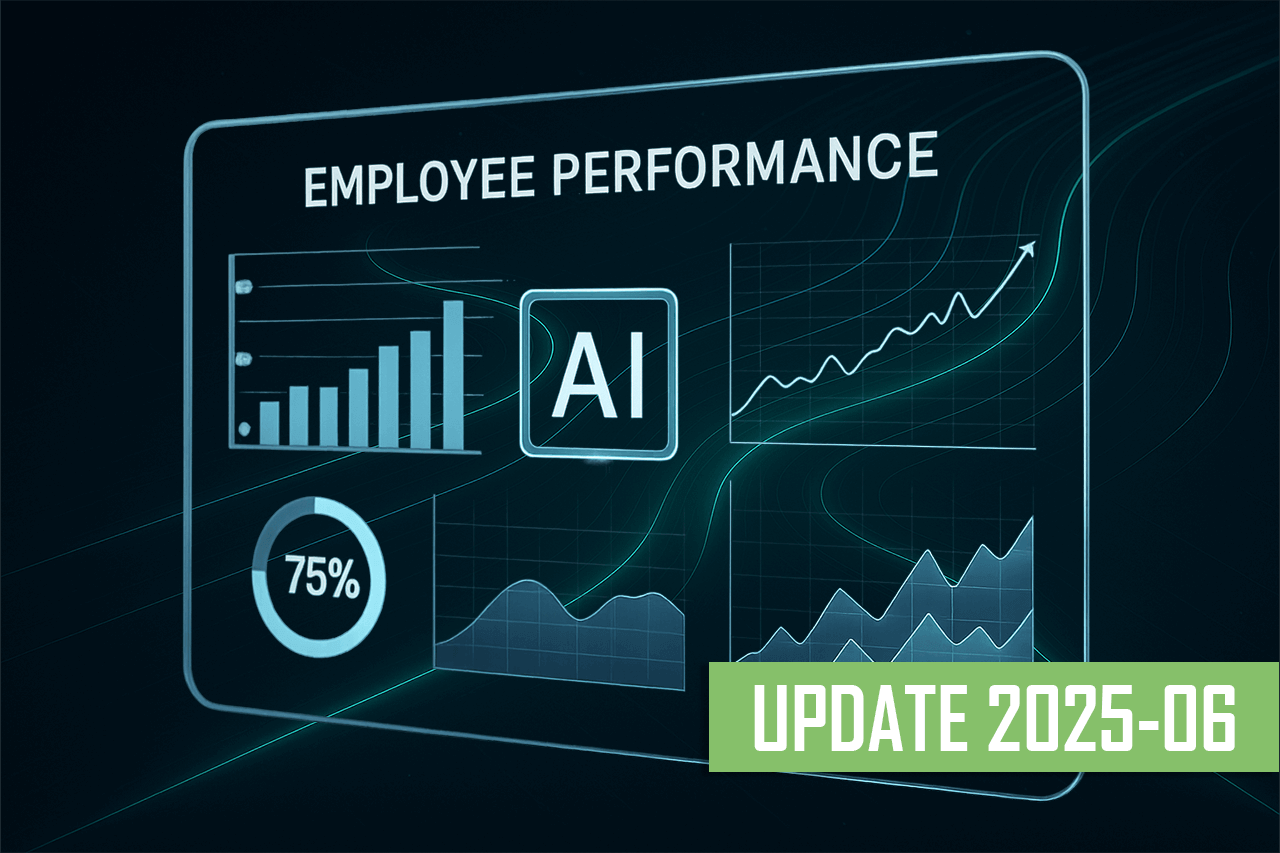
🎯 Ad Channel Performance Measurement System
Comprehensive Analytics for Online and Offline Channels
Thanks to the new advertising channel analytics tool, you will get precise answers to key questions: where do your customers come from, how much money is spent on acquiring them, and how profitable are your advertising campaigns.
What has changed:
- Before: Scattered data from different sources, difficulty in tracking ROI
- After: A unified system for collecting and processing data from all advertising channels
Key features:
- Automatic data collection from Google Analytics
- Tracking of offline sources via special codes
- Creation of clear performance graphs
- Comparative analysis of all advertising sources
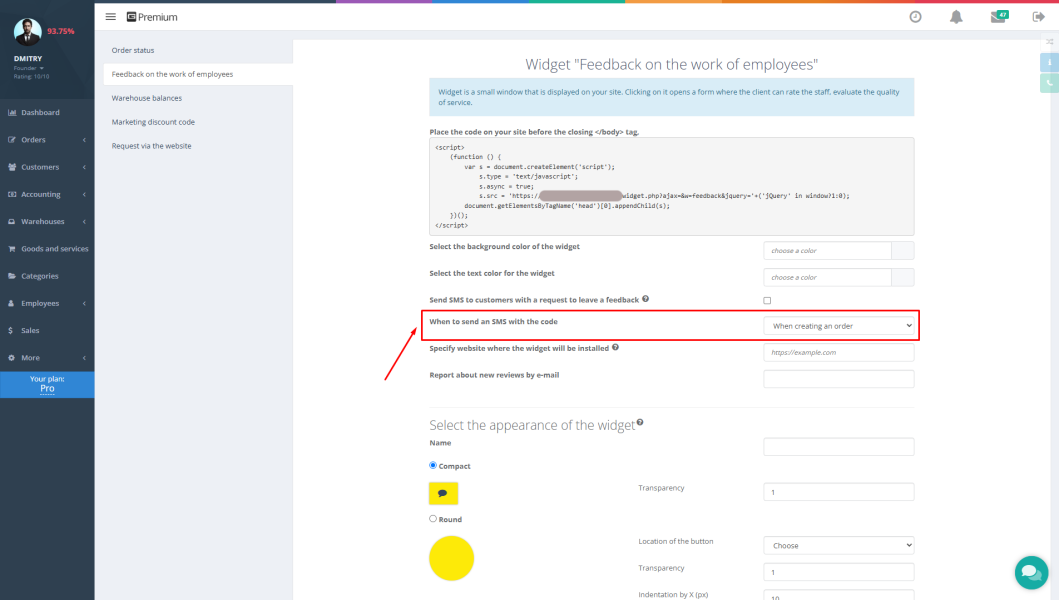
Innovative Code System to Bridge Online and Offline
The updated interface will help you find the necessary functions faster and save time, thanks to a special script that generates unique codes for each website visitor.
How it works:
- A visitor comes to your website and sees a personal “discount code”
- When contacting the service center, the customer provides this code
- The system automatically links the physical order to the online session
- The entire visit history and traffic sources are saved for analysis
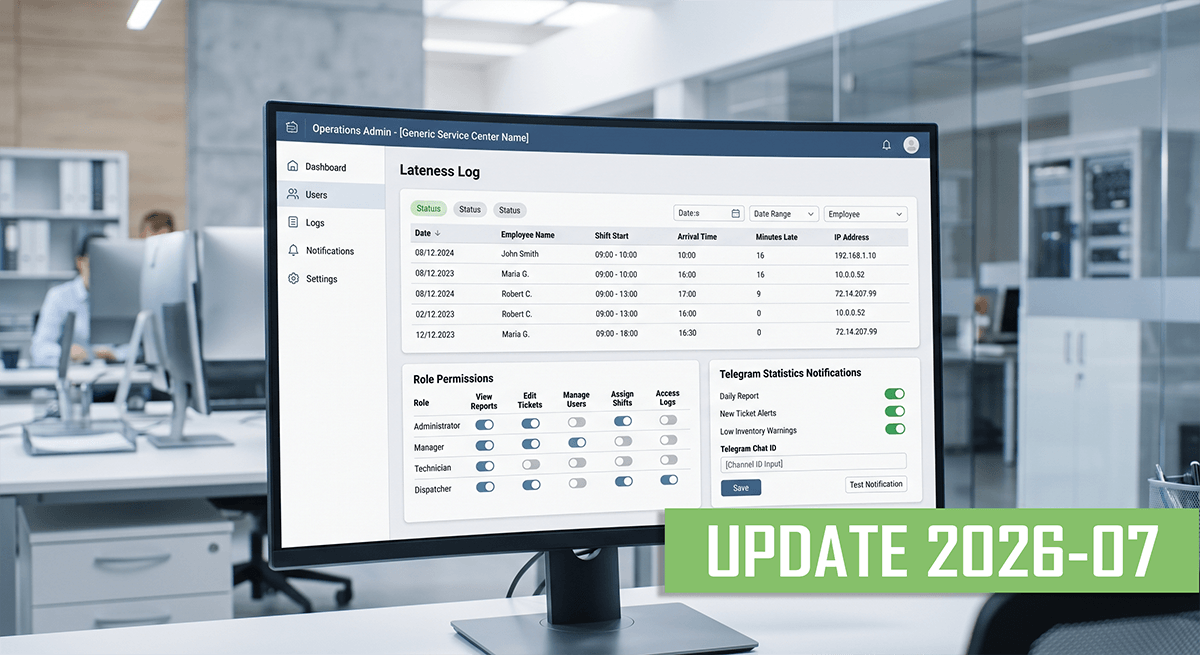
📊 Advanced Reporting System
Comprehensive Analytics in One Place
The new “Statistics” section provides a complete picture of your business's performance for any selected period.
| Category | Metric | Description |
|---|---|---|
| Traffic | Website Visitors | Total number and percentage of new users |
| Conversions | Bounce Rate | Conversion to calls and inquiries |
| Customers | Lead Processing | Percentage of customers who actually visited the service center |
| Finance | Revenue and Profit | Total revenue, profit, and average check |
| Marketing | Acquisition Cost | Marketing cost to acquire one customer |
Detailed Channel Analysis
The system allows you to view all metrics for each advertising channel separately, including subcategories for internet sources with automatic data loading from Google Analytics.
🔄 Assisted Conversion Tracking
Fair Performance Attribution
The updated system accounts for assisted conversions and correctly attributes the weight of each channel, even if the customer interacted with various advertising media before placing an order.
Advantages:
- More accurate assessment of each channel's contribution
- Fair budget allocation among sources
- Understanding the complete customer journey to purchase
💰 Cashless Payments via Fiscal Registrar
Simplified Payment Process
We've added the ability to accept cashless payments through a fiscal registrar. In the fiscal device settings, you can specify the cash register through which cashless payments will be processed.
Practical application:
- Customers can pay for services with a card directly at the service center
- Automatic generation of fiscal receipts
- Simplified reporting for cashless transactions
📧 Automatic Emailing of Receipts
Modern Service for Customers
The system now automatically sends electronic receipts to customers' emails, which meets modern business requirements and enhances the level of service.
Benefits for the business:
- Compliance with legal requirements
- Increased customer loyalty
- Savings on printing paper receipts
- Convenience for customers in managing their personal records
🚀 Examples of Using the New Features
Scenario 1: Analyzing Advertising Effectiveness
A service center owner launches ads on Google Ads and social media. A week later, they go to the “Statistics” section, select the period, and see that Google Ads brought in 50 visitors, of whom 10 called, 7 visited the center, and 5 paid for services. With an average check of $200 and an ad spend of $300, the ROI is 233%, indicating a highly effective channel.
Scenario 2: Tracking Offline Sources
A customer saw an ad on a social network, visited the website, got a discount code, but didn't call right away. Two days later, they came to the service center and gave the code. The system automatically linked their visit to the original source—the social media ad.
“We can only manage what we can measure.”
Conclusion
The updated Gincore provides you with powerful tools to make informed, data-driven decisions. Similar solutions from Google or other large companies cost tens of thousands of dollars a year, while we offer comprehensive analytics absolutely free for Gincore users.
Try the new features today and share your feedback! Our specialists are ready to help you set up the integration of your Gincore account with Google Analytics for maximum efficiency.